Pestcura Pest Pressure Index
The 2026 U.S. Rodent Pressure Index
25 U.S. metros, ranked by measured search demand for rat and mouse help and what pest-control advertisers actually pay for a call. Jacksonville is No. 1, Tucson leads every major metro in the country in “rat control” search interest — and America’s three biggest cities land mid-table or lower.
By Eli Hartman · Pestcura Editorial · Last updated October 14, 2026
Search data pulled October 8, 2026 · Bid data: May 2026 network snapshot
Jacksonville faces more rodent pressure than any other metro in the 2026 Pestcura Rodent Pressure Index — a ranking of 52 major U.S. media markets by two measurable signals: how intensely residents search for help with rats and mice, and what pest-control advertisers pay for a customer call in that market. Portland, Houston, San Diego, and Kansas City round out the top five.
The pattern departs from our wasp index. Where wasp pressure concentrated in northern metros, rodent pressure runs through the Sun Belt and the coasts: Jacksonville, Houston, San Diego, Tucson, Atlanta, Dallas–Fort Worth, Orlando, and Tampa all sit in the top twelve, and Florida and California each place four metros in the top 25. The interior exceptions — Kansas City, Cincinnati, Milwaukee — get there on mouse searches, not rat searches. And the three biggest cities in the country land mid-table or lower: Los Angeles 13th, New York 32nd, Chicago 47th. That is not a mistake; it is what this index measures, and the methodology below explains exactly why.
Four metros reach 50 on demand and 84 on call value at the same time — Jacksonville, Portland, Houston, and San Diego — and they are, precisely, the top four. Every number in this ranking traces to one of two sources: Google Trends metro-level search data pulled October 8, 2026, or Pestcura’s own network of ZIP-level advertiser bid tables. The full methodology — including what this index does not measure — is published below.
The 2026 index: 25 U.S. metros ranked
Scores are 0–100 composites: 60% search demand, 40% advertiser call value. Fifty-two metros were evaluated; the top 25 are published.
| # | Metro | Index score | Demand (0–100) | Call value (0–100) | Median advertiser call value |
|---|---|---|---|---|---|
| 1 | Jacksonville, FL | 82.5 | 81.4 | 84.1 | $120 |
| 2 | Portland, OR | 78.7 | 69.8 | 92.1 | $125 |
| 3 | Houston, TX | 71.0 | 57.0 | 92.1 | $125 |
| 4 | San Diego, CA | 66.8 | 50.0 | 92.1 | $125 |
| 5 | Kansas City, MO | 63.2 | 65.1 | 60.3 | $105 |
| 6 | Tucson, AZ | 61.9 | 100.0 | 4.8 | $70 |
| 7 | Atlanta, GA | 61.6 | 36.0 | 100.0 | $130 |
| 8 | Dallas–Fort Worth, TX | 61.2 | 51.2 | 76.2 | $115 |
| 9 | Cincinnati, OH | 60.4 | 60.5 | 60.3 | $105 |
| 10 | Milwaukee, WI | 59.0 | 58.1 | 60.3 | $105 |
| 11 | Orlando, FL | 57.7 | 45.3 | 76.2 | $115 |
| 12 | Tampa, FL | 55.4 | 62.8 | 44.4 | $95 |
| 13 | Los Angeles, CA | 53.9 | 33.7 | 84.1 | $120 |
| 14 | Virginia Beach, VA | 53.5 | 38.4 | 76.2 | $115 |
| 15 | Columbus, OH | 52.7 | 47.7 | 60.3 | $105 |
| 16 | Detroit, MI | 52.0 | 46.5 | 60.3 | $105 |
| 17 | San Francisco, CA | 50.2 | 48.8 | 52.4 | $100 |
| 18 | Minneapolis, MN | 49.9 | 43.0 | 60.3 | $105 |
| 19 | Miami, FL | 48.9 | 36.0 | 68.3 | $110 |
| 20 | Sacramento, CA | 47.9 | 65.1 | 22.2 | $81 |
| 21 | Pittsburgh, PA | 47.2 | 38.4 | 60.3 | $105 |
| 22 | Denver, CO | 46.6 | 62.8 | 22.2 | $81 |
| 23 | Cleveland, OH | 44.3 | 33.7 | 60.3 | $105 |
| 24 | Omaha, NE | 43.0 | 31.4 | 60.3 | $105 |
| 25 | Baltimore, MD | 41.9 | 69.8 | 0.0 | $67 |
- Metros with identical one-decimal scores are listed alphabetically; none occur in the top 25 (two ties occur further down the 52-metro table).
- One media market = one row: Dallas–Fort Worth includes both cities; Los Angeles includes Riverside; San Francisco includes Oakland and San Jose; Tampa includes St. Petersburg and Sarasota; Orlando includes Daytona Beach and Melbourne; Miami includes Fort Lauderdale; Sacramento includes Stockton and Modesto; Cleveland includes Akron and Canton; the Virginia Beach row is the Norfolk–Portsmouth–Newport News market. Search figures reflect each metro’s full media market (Nielsen DMA); call values are the anchor city’s median.
Use this chart
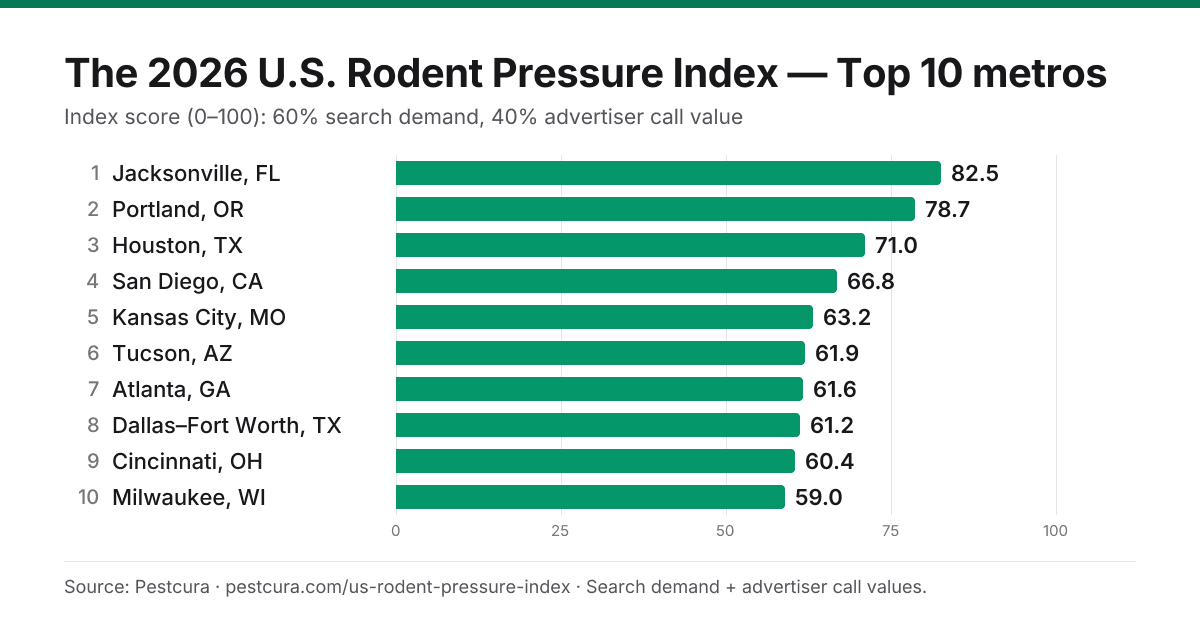
Free to republish with attribution. Copy the embed code:
<a href="https://pestcura.com/us-rodent-pressure-index"><img src="https://pestcura.com/charts/us-rodent-pressure-index-2026-top10.png" alt="2026 U.S. Rodent Pressure Index — Top 10 metros, ranked by search demand and advertiser call values (Pestcura)" width="1200" height="630"></a><br><small>Source: <a href="https://pestcura.com/us-rodent-pressure-index">Pestcura U.S. Rodent Pressure Index 2026</a></small>The top ten, city by city
1. Jacksonville, FL — 82.5. The only metro in the index above 80 on both axes. Jacksonville’s “how to get rid of rats” search reading is one of the four highest of all 210 U.S. media markets, its commercial terms run strong across rats and mice alike, and advertisers back it with a $120 median call value — the same tier as Los Angeles. Florida leads this table: Orlando (11), Tampa (12), and Miami (19) follow. Homeowners can start with rodent control in Jacksonville.
2. Portland, OR — 78.7. Portland posts the second-highest hire-a-pro reading in the index — its commercial search median (25, tied with Baltimore) trails only Tucson’s — and pairs it with a $125 median advertiser call value, the second-highest tier in the index behind Atlanta’s $130. Demand and price both land in the top five; no other metro north of the Sun Belt comes close. Rodent control in Portland.
3. Houston, TX — 71.0. Strong on both axes: 57.0 demand and the same $125 median call value as Portland and San Diego. Texas places two metros in the top ten — Houston and Dallas–Fort Worth (8) — and Houston is the higher of the two on both demand and price. Rodent control in Houston.
4. San Diego, CA — 66.8. A rat market more than a mouse market: San Diego’s rat terms rank far higher among the 52 metros than its mouse terms, on both the commercial side (“rat control” 18, tied for fifth, vs. “mouse exterminator” 14, tied for 25th) and the informational side (“how to get rid of rats” 14, tied for sixth, vs. “mice” 8, tied for 45th). Paired with a $125 median call value, that is enough for fourth — the highest-ranked California metro, ahead of Los Angeles (13), San Francisco (17), and Sacramento (20). Rodent control in San Diego.
5. Kansas City, MO — 63.2. The highest-ranked mouse market in the index. Kansas City’s “mouse exterminator” reading (34) is the second-highest of the 52 metros, behind only Cincinnati, and its “how to get rid of mice” reading (20) is tied for the highest in the index with Cincinnati and Denver. Fifth-highest demand overall, tied with Sacramento. Median advertiser call value: $105 — a flat $105 band, which nine of the 25 metros on this table share.
6. Tucson, AZ — 61.9. The highest search demand in the index, and it is not close: Tucson is the only metro to hit the demand ceiling (100.0), with the next-highest, Jacksonville, at 81.4. It is corroborated across terms — Tucson’s “rodent control” and “rat control” readings are each the second-highest of all 210 U.S. media markets, and its mouse terms are among the lowest in the index. This is a rat market, not a mouse market, and the rat demand matches the biology: the University of Arizona Cooperative Extension documents roof rats as established in “the Phoenix Metro Valley, Yuma, and Tucson areas,” most active “during the cooler months of winter and spring (November through May),” alongside white-throated pack rats that “will sometimes opportunistically move into the attics and walls of houses.” Tucson sits sixth rather than first for one reason: a $70 median advertiser call value, among the five lowest in the index. Residents search harder than anyone else in the index; the market pays less than almost anyone to answer.
7. Atlanta, GA — 61.6. Atlanta carries the single highest advertiser call value in the index — a $130 median top bid, the ceiling every other metro is scaled against. Search demand is modest (36.0); what puts Atlanta seventh is what the market pays when the call comes. Rodent control in Atlanta.
8. Dallas–Fort Worth, TX — 61.2. Balanced rather than extreme: 51.2 demand and a $115 median call value. The market spans Dallas and Fort Worth — one media market, one row. North Texas is also the one top-ten market where Pestcura publishes a seasonal disease report: see the North Texas mosquito report.
9. Cincinnati, OH — 60.4. The highest “mouse exterminator” reading of any metro in the index (40), and tied for the highest “how to get rid of mice” reading (20). Cincinnati is the mouse capital of this table, and Ohio again places three metros in the top 25 — Cincinnati, Columbus (15), and Cleveland (23) — exactly as it did on the wasp index. Median call value: $105.
10. Milwaukee, WI — 59.0. Another mouse-driven entry: Milwaukee’s “how to get rid of mice” reading (19) is the fourth-highest in the index, and its demand score (58.1) edges Houston’s. Median call value: $105.
The bottom of the table, and the list that says the opposite
Baltimore has the third-highest demand score in the entire index (69.8, tied with Portland) and finishes 25th, because its $67 median advertiser call value is the lowest of the 52 metros. Boston (demand 64.0, seventh-highest) finishes 27th for the same reason. Those are the search-high, price-low markets, where residents search hard and the industry pays little for the call. At the other end, Las Vegas has the second-lowest demand score in the index (10.5) and still finishes 31st on a $115 call value. El Paso is last, with the lowest demand score in the index.
Then there are the biggest cities. Orkin’s 2026 Rattiest Cities list, released October 13, 2026, ranks Los Angeles first, Chicago second, New York third, San Francisco fourth, and Washington fifth; Orkin builds it from its own count of new residential rodent treatments between August 9, 2025 and August 9, 2026. A count of treatments scales with the number of homes a market has, so the largest metros rise to the top. This index asks a different question: relative to everything else people in a market search for, how intensely are they looking for help with rats and mice — and what does the market pay to answer? By that measure Los Angeles ranks 13th (carried by a $120 call value, not by demand), New York 32nd, and Chicago 47th, while Jacksonville and Tucson — neither of which appears in Orkin’s top 50 — lead on search pressure. Where the two lists agree is instructive too: Baltimore and Boston rank in this index’s top ten on demand and in Orkin’s top 13, and Denver is eighth on demand here (tied with Tampa) and eighth on Orkin’s list. Neither list counts rats. One counts treatments sold; this one measures demand and price.
A low rank here means low relative search intensity or a low call value, not an absence of rodents. Rats and mice are covered as a service under rodent control.
How the index is built
The Pestcura Rodent Pressure Index scores 52 major U.S. media markets and publishes the top 25, using the same method as the 2026 U.S. Wasp Pressure Index. Each metro’s score is a 0–100 composite of two axes: Score = 0.6 × Demand + 0.4 × Price.
Demand (60%). Google Trends, metro (DMA) level, trailing 12 months, pulled October 8, 2026, across a five-term basket: “rodent control,” “rat control,” and “mouse exterminator” (commercial intent), plus “how to get rid of mice” and “how to get rid of rats” (informational). The three commercial terms enter as a median — a deliberate robustness choice, so no city can ride a single anomalous commercial-term value up the table. The two informational terms enter as a mean. The two groups blend 50/50, and the blend is rescaled linearly so the highest metro (Tucson) reads 100 and the lowest (El Paso) reads 0.
Price (40%). The axis nobody else publishes: what pest-control advertisers actually bid for a customer call, by geography. Pestcura’s network bid tables — more than 40,000 named-ZIP bid records nationwide, spot schedule, May 2026 snapshot — aggregate to a median top bid for each metro’s anchor city. No advertiser is named and no individual bid is exposed; only the metro median is published. Medians rescale linearly from the lowest in the set (Baltimore, $67) to the highest (Atlanta, $130).
Why the blend matters. Tucson has the highest demand score in the index and one of its lowest call values — it lands 6th, not 1st. Baltimore has the third-highest demand score and the lowest call value — it lands 25th. Demand tells you who’s asking; price tells you what answering is worth. Pressure is both.
How stable is the ranking? We re-ran it under four alternative search baskets (swapping terms, using four commercial terms, using a mean instead of a median, and using “rodent control” alone). Jacksonville, Portland, and Houston are in the top four under every variant, San Diego never falls below fifth, and Tucson finishes between first and seventh in all of them. Within the top ten, the metros whose rank depends most on basket composition are the mouse-driven interior markets — Kansas City and Cincinnati — which move between the top five and the low-to-mid teens depending on how heavily mouse terms are weighted; Milwaukee, also mouse-driven, ranges from 10th to 15th. A rodent index has to include mice, so they stay; their ranks are among the least settled in the top ten.
One media market counts as one metro: Dallas–Fort Worth is a single row, Los Angeles includes Riverside, and San Francisco includes Oakland and San Jose. The index re-ranks annually at this URL.
What this index does not measure
- Trends values are relative search interest — a term’s share of all searches in a market — not infestation counts, call volumes, or treatment counts. Google samples its data, so values can shift between pulls; the top-four gaps are wider than a ±2 wobble in any single search term.
- Because the demand axis is relative, two of the largest and most diverse search markets (Chicago, Los Angeles) are structurally hard to rank near the top on it. That is a property of the measure, stated here so no one has to discover it.
- The price axis is Pestcura network data — real advertiser bids, but one network’s, from a May 2026 snapshot — and it prices pest-control calls generally, not rodent calls specifically.
- Nothing in this index measures infestations, which is why this page does not claim to rank the most infested cities. It ranks pressure: measured demand and measured market price, nothing else — no treatment counts, no trade-association statistics.
- A media-market merge can flatter or dilute a metro: Fort Worth’s searches count toward the Dallas row, Riverside’s toward Los Angeles, San Jose’s toward San Francisco.
If your city made this list
Fall is when it starts. House mice “frequently enter homes in autumn when nighttime temperatures become colder” (University of California Statewide IPM Program, House Mouse, updated July 2025), and in Arizona’s low-desert cities, roof rats are most active November through May (University of Arizona Cooperative Extension). Mice can get in through an opening as small as a quarter inch — “a hole the width of a pencil,” in the CDC’s words — which is why trapping without sealing is a treadmill: UC IPM calls exclusion “the most successful and permanent form of house mouse control.” The CDC recommends traditional snap traps, says not to use glue traps or live traps, and reserves poison for infestations that persist — and UC IPM notes that rodenticide used indoors “will often result in house mice dying inside the structure,” with the odor that implies.
Professional rat extermination typically runs $150 to $600 (HomeGuide, updated September 2025), mice $150 to $550, and a large rat infestation that requires sealing the building and cleanup can run $1,500 to $8,000. That last number is the one to avoid, and the way to avoid it is to act in October, not January. For the trap-and-seal method step by step, see the guide to getting rid of mice; for help now, start with rodent control — or skip straight to a licensed local pro.
Sources
- Google Trends — metro-level (DMA) search interest, trailing 12 months; pulled October 8, 2026.
- Pestcura network advertiser bid tables — May 2026 snapshot (aggregated metro medians only).
- University of Arizona Cooperative Extension — Roof Rats: Identification, Ecology, and Signs (az1775, Rivadeneira & Gouge, July 2018). extension.arizona.edu
- University of California Statewide IPM Program — House Mouse, Pest Notes Publication 7483 (updated July 2025). ipm.ucanr.edu
- U.S. Centers for Disease Control and Prevention — How to Seal Up to Prevent Rodents (reviewed April 8, 2024). cdc.gov
- U.S. Centers for Disease Control and Prevention — How to Trap Up to Remove Rodents (reviewed April 8, 2024). cdc.gov
- HomeGuide — How Much Does a Rat Exterminator Cost? (2026), revision dated September 2, 2025. homeguide.com
- HomeGuide — How Much Does Rodent Removal Cost? (2026), revision dated September 2, 2025. homeguide.com
- Orkin — “Los Angeles Holds No. 1 Spot on Orkin’s 2026 Rattiest Cities List,” press release, October 13, 2026. prnewswire.com
- Pestcura — The 2026 U.S. Wasp Pressure Index
Pestcura is a nationwide network connecting homeowners to licensed local pest control professionals; we do not perform pest control services. This index is an editorial data compilation for public information. Rankings reflect measured search demand and advertiser bid data only, and are not a measure of infestation rates or public-health risk.